Delivery
Team Planning ICS
A Gantt-style planner that reads from any ICS calendar feed (Google Calendar, Outlook), with a per-project budget and revenue calculated to the exact day's prorata. Open source, maintained by me, and yours to make your own.
Project background
This tool was born from a very concrete need at my agency, Licorn: seeing who was working on what without re-entering the same information anywhere else. The team calendar already existed, with one event per person and per project. All that was missing was a Gantt view that read it directly, instead of yet another spreadsheet to maintain in parallel that would inevitably drift out of sync with reality.
The internal version worked well, but it pointed at the agency's own infrastructure: a hardcoded calendar URL, a project name baked into the title. None of that needed to stay hidden, it just needed to be made generic so anyone could plug in their own calendar without touching the code.
Revenue tracking came next, for the same reason as the planning view itself: the information already existed (a budget per project), it just lacked the view that ties it to the reality of team allocation rather than a fixed assumption frozen in a spreadsheet.
Features
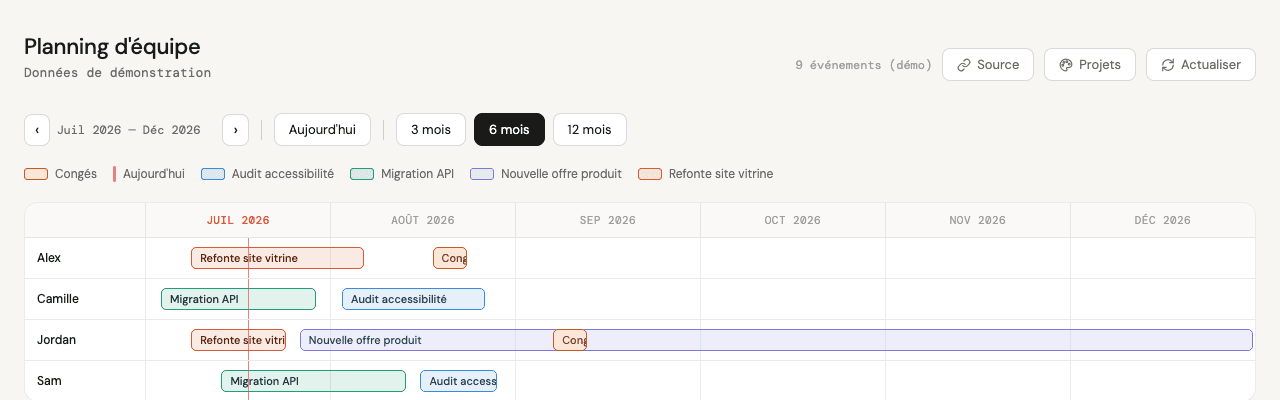
A Gantt timeline, read straight from your calendar
Each person gets a row, each calendar event becomes a bar over the relevant period. Navigate by month, switch between 3/6/12-month views, and distinguish projects from time off at a glance.
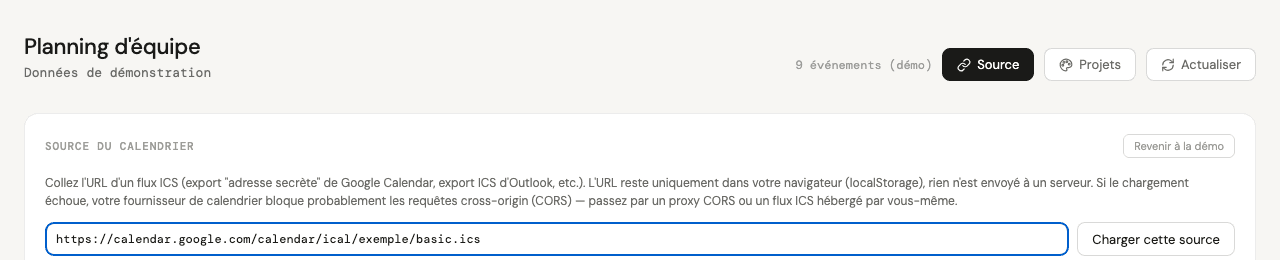
A data source you control
Your ICS feed URL (Google Calendar, Outlook, or any exportable calendar) is pasted directly into the interface and stays in your browser only. No intermediate server, nothing to configure in code.
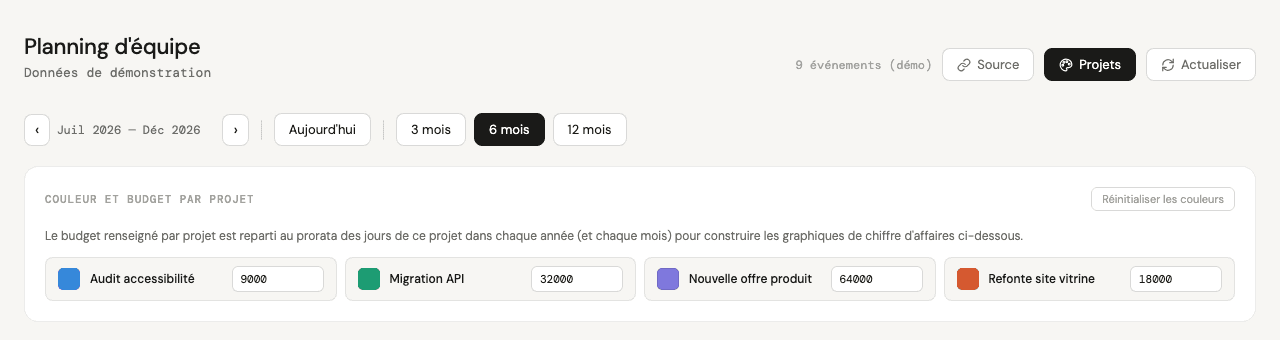
Colour and budget per project
Each project gets its own colour, remembered locally and reused throughout the tool. The budget entered here directly feeds the revenue charts.
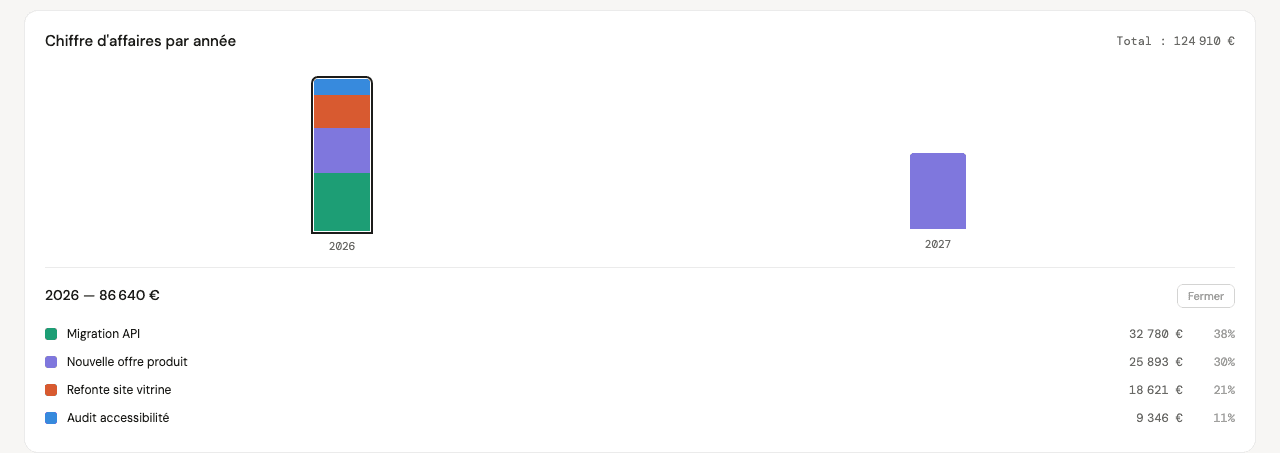
Revenue by year, at the exact prorata
A project spanning two years splits its budget between them based on the real number of days on each side of the boundary, not an arbitrary cutoff. Click a column to see the exact breakdown by project.
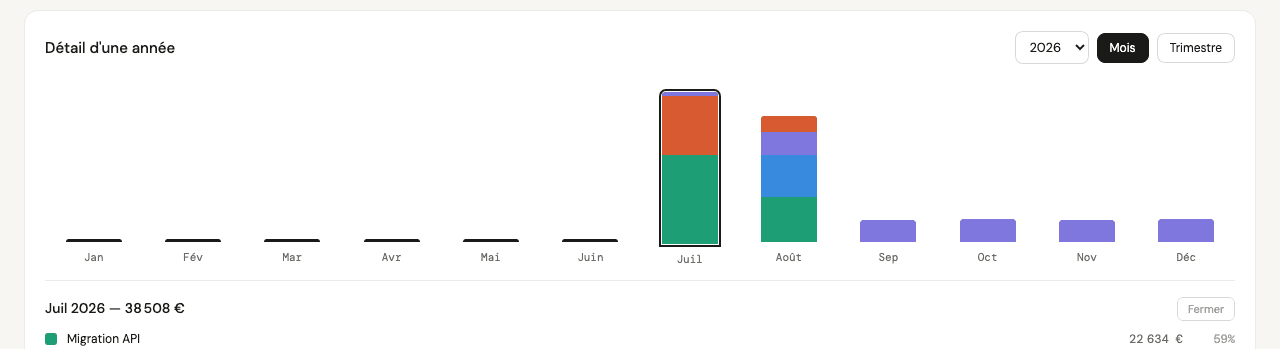
Monthly or quarterly detail
The same data broken down by month or quarter for a chosen year, with the same click-to-detail on every column.
Get the tool
It's a single HTML file, no dependencies and no build step: fork or clone the repo, then open `index.html` locally or deploy it as-is to GitHub Pages, Netlify, Vercel, or any static host.
No data is sent to a server: your calendar URL, colours, and budgets all stay in your browser's local storage. Note that the demo interface itself is currently in French, pull requests adding an English UI are welcome.
Open to improvements
This tool evolves based on my own needs, but it's public so it can be useful to others too. An improvement idea, a bug, a use case that doesn't quite fit: issues and pull requests are welcome on the GitHub repo.
Frequently asked questions
Is my calendar data sent to a server?
No. The tool is a static page: your ICS feed URL and your settings stay only in your browser's local storage.
Can I use this tool for my own team?
Yes, that's the point. The source code is public under the MIT license on GitHub: host it as-is (a single HTML file, no dependencies) or modify it freely.
How is revenue per project calculated?
You enter a total budget per project; it's split according to the number of days that project spans within each calendar month. A project straddling two years splits its budget between them based on the exact day count on each side of the boundary.